The Obama Effect
Updated June 30 2012
Early in Barack Obama’s campaign for the Democratic nomination to run for President, there was high interest, and when he won the Iowa primary, it jumped to another level. The interest was not only local, but worldwide, and as the campaign gathered momentum, it also garnered more attention from around the globe. This was likely due in part to Obama’s gifts as a speaker, but surely was greatly affected by the possibility people could see for an important development in the US national character: There was a powerful focus on a black man with what appeared to be a real chance to become the President of the United States, the first in our history.
This page looks at the compelling aggregation of GCP network responses during especially powerful events with Barack Obama as the central figure. As of June 2012, we have specified formal hypothesis tests for eleven events, beginning with the nomination in June of 2008. In the following list, you can click on the name to go to the detailed description and statistical analysis for the events.
- Obama wins the Democratic Party Nomination
- Obama’s Acceptance Speech at the Democratic Party Convention
- Barack Obama is elected the 44th President of the United States
- The Inaguration of President Barack Obama
- Obama wins the Nobel Peace Prize
- Obama gives his first State of the Union Address
- Obama signs the Health Care Reform Act
- President Obama declares the long Iraq war is over
- President Obama speaks at the Tucson memorial service
- Obama gives his 2011 State of the Union Address
- Obamacare survives Supreme Court test
Of the 11 formally specified events we have examined, 9 have yielded a positive result in accord with our expectation, and four of these meet the 5% standard of statistical significance individually. In addition to these formal tests, interesting results are shown in other explorations. Using a protocol that differs from the GCP’s, I did what is known as a FieldREG
recording for an Obama Rally that I attended in Chester PA, Oct 28, 2008. It showed a significant statistical result. Another FieldREG recording was done by GregoryDF, who I believe lives in France, using the OnlineFieldREG service of Psyleron, Inc., a US company. The results are detailed in a page at Info-Psi.com describing a careful assessment of data taken before, during, and after Obama’s inauguration.
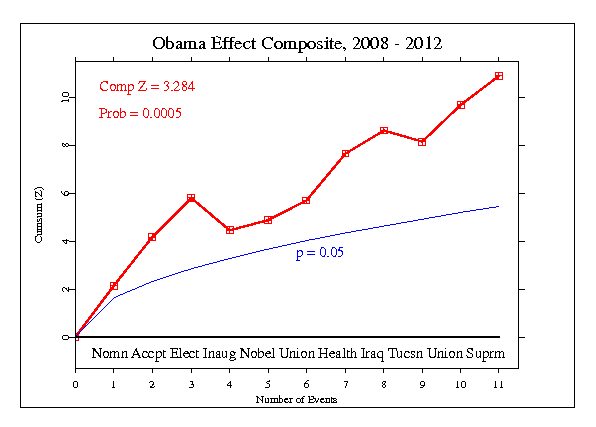
The explorations are interesting, but the a priori formal hypothesis tests provide reliable statistics which can be safely interpretated. To simplify this, we can combine the results for the 11 formal tests using a Stouffer’s Z calculation of the average Z-score across the tests. This is a standard procedure that gives an unweighted Z-score that can be thought of as an average Z. This procedure yields a composite value of 3.284, which has an associated probability of 0.0005, or an odds ratio of about 2000 to 1. A second method (more conservative because no directional prediction is made) for evaluating the likelihood of the string of scores is to look their group variance. This is done by calculating the sum of the squared Z-scores, and testing it against the number of scores. The result is Chisquare 22.982 on 11 degrees of freedom, which corresponds to a p-value of 0.018.
The following graph displays the sequence of 11 scores as a cumulative departure from what is expected. The expectation is a random series of steps with no trend, varying around the horizontal line at zero. The red line shows the actual data, with each point representing the accumulated deviation up to that time. The last value corresponds to the final composite value, which is the test statistic for the hypothesis that there will be a positive deviation when President Obama is central to an event. The updated Z and p=value are shown in the graph.

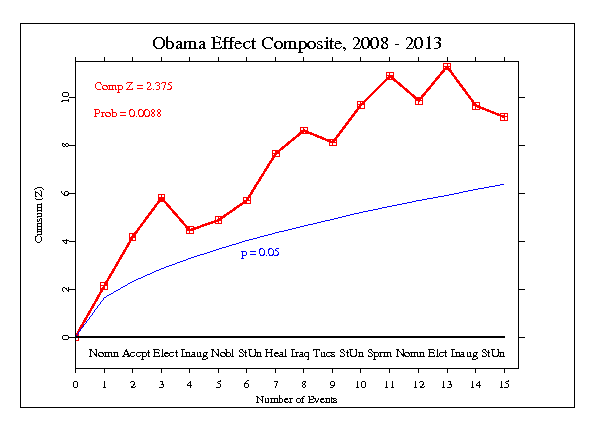
The last few months have seen four more events with Obama at the center, 3 of which were formal. I have added all four to the accumulation. Only one was positive, the election itself, and the curve is flattening out, but the statistic for the Obama effect
remains significant. It is interesting to see that the Inauguration was again strongly negative as it was in 2009.

The accumulation so far of events in the category of Barack Obama as a central figure
is still too small for persuasive interpretation. But it is well along. The results so far certainly are thought provoking, particularly for questions about what drives the correlations in the GCP network. We think a likely factor is a kind of coherence of emotions shared by large numbers of people, and perhaps that is reflected in the Obama data.
For individual events, we caution that since we have only a tiny statistical effect, it is hard to distinguish signal from noise. This means that every success
shown for an event analysis might be largely driven by chance, and every null
might include a real signal overwhelmed by noise. In the long run, a real effect can be identified only by patiently accumulating replications of similar analyses.
