Barack Obama Elected President |
|
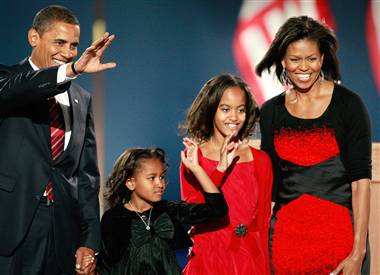
President-elect Barack Obama walks on stage at his victory
Story By Alex Johnson, Reporter, msnbc.com
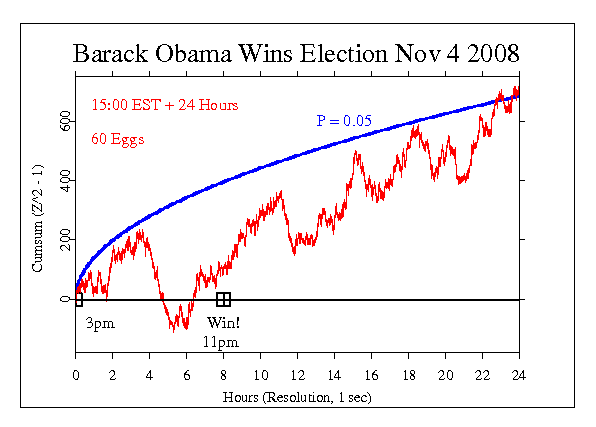
The GCP prediction for this momentous event was set for the 24 hour period beginning at 15:00 Eastern time (20:00 UTC) on November 4th. This includes several hours of election day in the US, and enough time for the votes to be counted to determine the winner of the election (assuming the margin would not be razor thin), and continues until most of the world has awakened to begin a day with a new US President-elect. Beginning about two hours before the official announcement that Obama had won, the data show a consistent positive trend that continues through the declaration at 23:00 ET and his subsequent speech to 125,000 people at Grant Park in Chicago and the public via TV. The formal data segment overall shows a significant positive trend through the 24 hour period. Chisquare is 87102 on 86400 df, for p = 0.046 and Z = 1.686. This represents a relatively large effect size compared with the average of Z = 0.33 over the full GCP database.

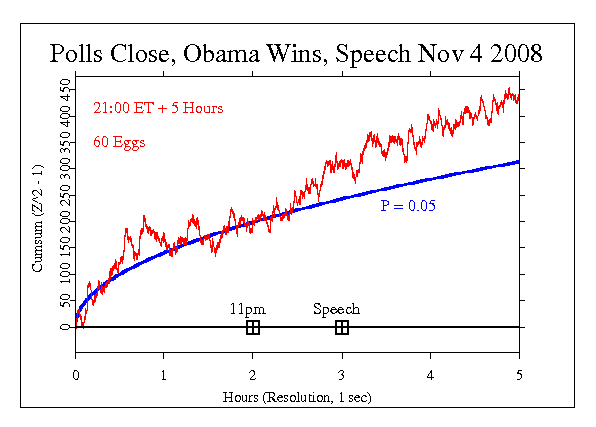
Late in the day, with a clear win in Pennsylvania and Ohio also decided for Obama, his win appears to be a fait accompli. At this time, about two hours before the official declaration, the data take on a steady positive trend. It continues through the formal announcement and McCain's concession speech at 11:00 pm and for two hours after Obama's acceptance speech in Grant Park at midnight. The following figure shows this period of time. This is of course a post hoc analysis, rather than a formal result, but the trend is consistent with the idea that the widespread and intense emotional response to Obama's election might register on our network.

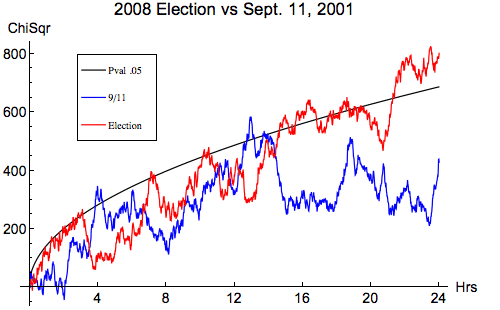
Alternate MeasuresThe huge worldwide interest and engagement in the 2008 election suggests a deeper exploration of the data is warranted. Early results using alternate measures are available. You will also be interested in the analyses for President Obama's Inauguration. There are three other Obama related GCP events that are consistent with an effect of his presence or charisma, though we can't make scientific claims beyond the finding of consistent correlations. In June, we identified the final determination that he would be the Democratic nominee as a formal event. Then, in August we did a formal assessment of his nomination acceptance speech. Yet another related measure was an informal, exploratory FieldREG recording at an Obama rally in Chester PA. All of these show positive, sometimes striking results. Shouldn't the effect be bigger?Given the powerful emotions aroused by Barack Obama's success, and the feeling of wonder and joy generated in huge numbers of people around the world, we might expect a correspondingly powerful effect in the GCP data. It is positive and significant at the usual 5% level, but it isn't "off the charts" and we are tempted to believe it should be. Quoting one correspondent, "I had hoped to see a bigger response, and this only increases my doubts about the consciousness hypothesis." This offers an opportunity to explain the statistical nature of the GCP question, "Is there a correlation of structure in our data with widely shared states of consciousness and emotion generated by great events?" The tools we have to answer this kind of question are averages and variance and correlations among the scores from all the devices in the network. Such measures have intrinsic variability, which is another way of saying they are "noisy." Thus, when we look for structure, we have to expect some difficulty differentiating real patterns from mere noise -- both signal and noise are represented by the same simple numbers. In general, to understand the data, we have to examine the distribution of the numbers to see if they are pushed away from the mean or spread out unexpectedly. If the distribution is distorted in identifiable ways (corresponding to the scientific predictions or hypotheses we have set) then we can say there is evidence for the signal we are looking for. Yet, because of the intrinsic variability, it can happen that the signal is obscured or weakened by an accidental but entirely normal excess of variation in the noisy background. Or, equally problematic, we may see an exciting trend or spike of activity that is just normal fluctuation. Here is our standard caution to encourage patience and to avoid over-interpretation of GCP data: It is important to keep in mind that we have only a tiny statistical effect, so that it is always hard to distinguish signal from noise. This means that every "success" might be largely driven by chance, and every "null" might include a real signal overwhelmed by noise. In the long run, a real effect can be identified only by patiently accumulating replications of similar analyses. In addition to this signal-to-noise issue, we know from categorization studies that celebrations (and the 2008 Election has a great deal of this quality) show relatively small effects in the standard Netvar statistic, but relatively large effects using one of our Alternate Measures called Covar, which looks at second order variance of the internode correlations. Finally, an instructive example of what is a "big" effect. The September 11 2001 terror attacks were analysed carefully and extensively, and we can conclude that the effects were among the largest in our 10-year database. The following figure shows a comparison of 24 hours of data from 9/11 beginning with the crash of the first plane into the World Trade towers, and a 24 hour period of data beginning with the announcement that Barack Obama had won the election to become the 44th President of the United States of America. The figure speaks for itself -- remembering that we cannot reliably interpret single events like this, nevertheless it appears that the election shows at least as strong an effect as the terror attacks. We can hope that the election is the beginning of truly positive change. 
|
