Early Results, New Year, 1999 to 2000

In this page we will present some of the early results for the Y2K events and predictions as they were developing right after New Years. Most of the work was preliminary, and there were mistakes and subsequent corrections, as noted in the accompanying text. Some of the figures and tables will be repetitions of those in the primary version, but are included for completeness and continuity. For an immediate look at some of the more striking indications of an effect of the coherence generated by the celebrations, you can skip ahead. Start here if you may want a more complete look at the analysis process as it has developed. Further explorations give more background and context, examining this complex database from other perspectives. Please recall that the following are preliminary results, pending independent cross-checks and the addition of late-arriving data. You can find the formal results elsewhere, but may find the context of the various associated explorations to be interesting and instructive. We begin with Dick Bierman's graph of the first data available from the GCP network, sent on the 1st of January.

First Data: Transition to 2000 in New Zealand, DJB

Hi to all,

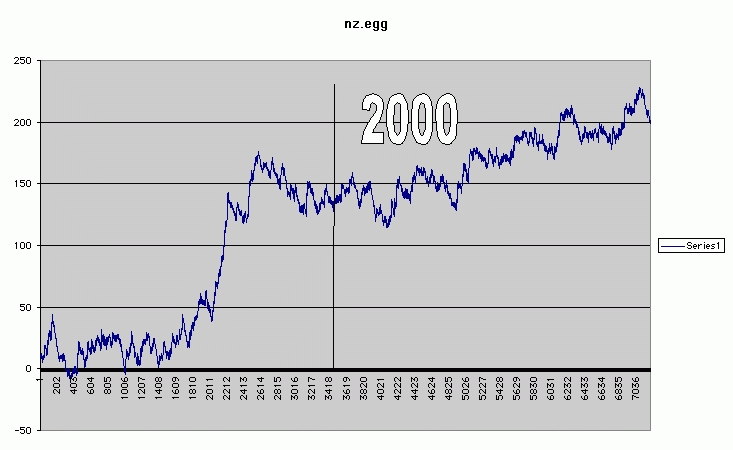
I wish you too a very happy new year. I couldn't resist to analyze the new zealand egg one hour before till one hour after the big moment. Apparently the internet didn't have any problem in New Zealand. The result is attached as a JPG file. The resolution is one second. As you can see there is a sudden rise in variance from about 30 minutes to about 15 minutes before the big moment. This looks a bit early but the picture is certainly convincing (due to the stability before and after the rise). Let's see what the others do!

Dick
New Zealand Egg, Y2K

First Seven Timezones, Year 2000, RDN

We continue with my own early efforts to satisfy a curiosity built over many months. The graph shows the cumulative deviation of Chisquare (Z²) over the combined data from all eggs and timezones.

Explorations of preliminary data are inevitable, I suppose; the curiosity is great, even though it is not feasible to do formal assessments. As progressively more data are available the actual planned analyses can be done. The following figure is an exploratory look at all the available data from the first several hours of the year 2000. Various constraints forced the use of 10-second blocking (e.g., I didn't have enough memory to process the raw data). Several eggs had missing data, three of them were mostly missing data; I ultimately simply shifted the valid data into the missing slots and dropped the three rightmost partial columns representing the 25 available eggs. The result, which is not only crude but selected, is presented for what it is worth (not much, in formal terms).

Roger

First 8 hours, 2000


Formal Year 2000 Analyses, GdB and RDN

The preliminary versions of planned Y2K analyses will be put here, and updated until all the data are in or some other criterion of completion is reached, at which point a final version will be put in the Y2K Results page. (This page was created on February 20, 2000, though some additions to the formal version are still required. A final version of the RDN prediction is presented below.) The following tables and figures were created by George deBeaumont. Interpretive remarks are by Roger Nelson, whom you should contact if you have questions.

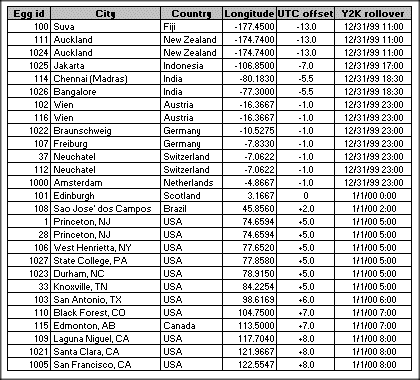
On Saturday, 1 Jan 2000, George sent the first-cut analyses of the set of 21 eggs which had reported as of that date. Seven have not yet reported, but probably do have data. The table lists the eggs ordered by longitude. Subsequent figures show the cumulative deviation of Chisquare (Z²) from theoretical expectation versus the time in seconds (or degrees of freedom).

Making crude "eyeball" estimates from all 21 egg trend graphs, I think there may be a small preponderance of positive slopes in the 10-minute periods centered on midnight, from which I estimate a bottom line composite of about Chisquare 12670 on 12600 df, for a p of about 0.33. The whole hour gives a similar probability, with Chisquare about 75753 on 75600 df, p = 0.346.

So, to the extent I've made reasonably good estimates, the combined outcome is positive, but the consistency is not sufficient for it to be significant. Only with quite strong positive results from the remaining several eggs is the overall result likely to be significant and persuasive. (The actual numerical combination is in fact slightly negative.)
RDN, 1 January, 2000

Table 1: Descriptive Information, All Eggs as of 2000-01-01

Table 1: Y2K, EGG table

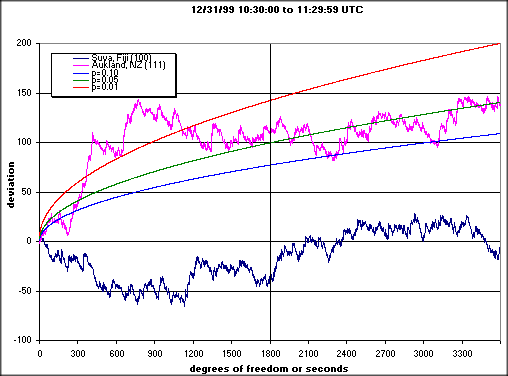
The random walk traces in the following figure each represent the data from one egg as it sees the Y2K rollover, and show 1/2 hour before and after the event.

Suva, Fiji; Auckland, New Zealand, 111

Suva, Fiji, 100 and
Auckland, NZ, 111

For a more detailed look at the individual traces, click here. By 2 January, 22 eggs had reported data. The 22 cumulative deviation lines are superimposed in the next figure. Note that the scale is changed to show only the 10 minutes surrounding midnight.

All Eggs as of 2 January, 2000

All Eggs, January 2

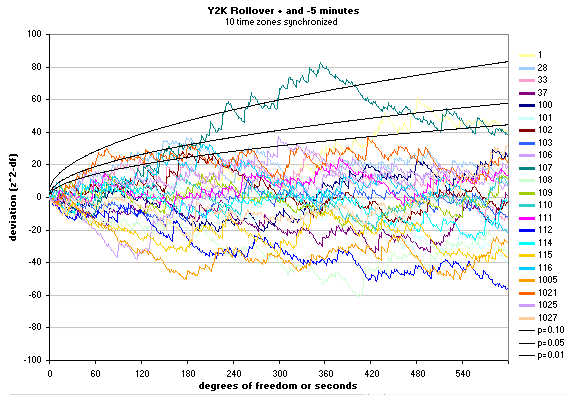
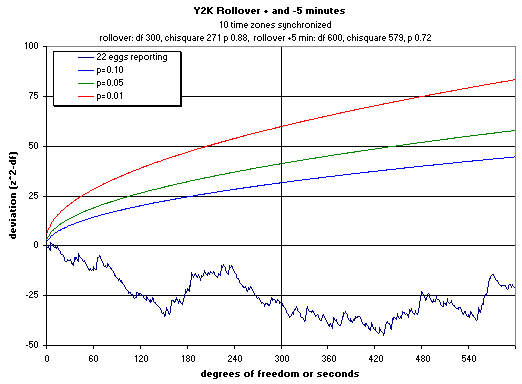
If these data are synchronized and summed, they represent the outcome for 10 timezones in which one or more eggs are operating.

Synchronized deviation of Chisquare around Midnight, Y2K

Synchronized sum of 22 eggs

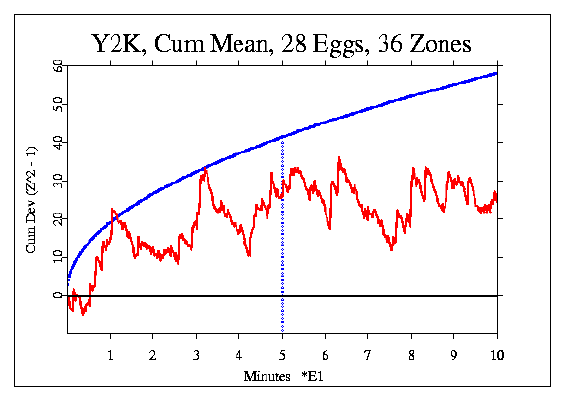
Final Analysis, Midnight ± 5 Min, Y2K

The intended analysis for this prediction requires the use of data from all eggs and all timezones. Data are available from 28 eggs across the 24-hour period of celebration around the world. Following George's precedent for the JAM analysis, all 36 zones with integer or half-hour differences from GMT were used for the following figure. In contrast to the 22 egg, 10 timezone analysis, the deviation is positive, with a Chisquare of 624.412 on 600 degrees of freedom, with a p-value of 0.237.

Synchronized sum of 
28 eggs

Smoothed Variance Data, DIR

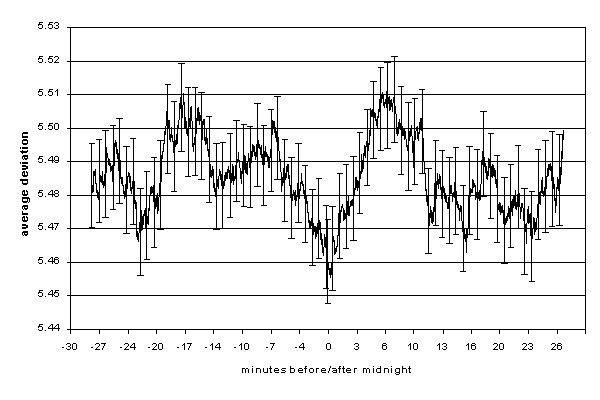
Dean Radin takes a different approach to the data, in analyses originally reported on the 2nd of January. The first results were extraordinary, and appeared to show structuring of the data around the Y2K transition very much in accord with Dean's prediction, but there was an error, in that the analysis considered only GMT instead of all time zones. The figures and description nevertheless serve to introduce the general approach. The second graph following, which shows the "odds ratio" corresponding to the smoothed average of the median deviation across eggs, presents a striking image of an event building to a peak at midnight. An explanation of the steps in this analysis provides useful background for later, corrected analyses.

Median Average Deviation of
eggs at Y2K Odds Ratio, UTC
centric eggs at Y2K

Since then we have determined that a conceptual error made that analysis centric to the GMT (UTC) time zone, and although the result showed a striking spike at midnight, it was not properly representative of Dean's prediction. A corrected analysis addressing the intended question was completed on 23 January, and redone subsequently with a simpler procedure. It is presented in the following figure. As explained in the detailed description this analysis is exploratory, but it has been thoroughly cross-checked, primarily using a permutation analysis, where the data are scrambled and the same analysis performed repeatedly, in this case 2000 times. This provides a background against which the actual data can be compared, and the Z-score combining the minimum value with the minimum time is -3.662, a value that corresponds to a probability against chance of 0.000125. (A larger permutation base of 10000 runs gives an even larger deviation of Z = -3.85, with a corresponding probability of p = 0.00006.)

Given that Dean's analysis procedure was not completly pre-specified, but was developed by trying several approaches, this probability needs to be adjusted to compensate fairly for the multiple opportunities for a good result, and the selection of the best of the multiple outcomes. The detailed description of the steps in Dean's original analysis is interesting and informative. Dean reports that he tried about 10 different analyses looking for ways to optimize a spike at the moment of interest (i.e., a deviation that peaks near midnight). The appropriate Bonferroni correction, multiplying the probability by a factor of 10, still leaves an impressive p-value of 0.0013 for the highly focused minimum at midnight for the Y2K transition.

The figure shows the result from this analysis, which uses a 5-minute sliding window smoothing the average deviation of normalized superposed epoch variances. This figure speaks for itself, strongly suggesting that something special did occur in the GCP data at midnight. The combined deviation drops precipitously as midnight approaches, and deviates by 3.662 (or as much as 3.85) Sigma at three seconds before midnight, the moment of transition.

Deviation of normalized variance, GCP Data, Y2K
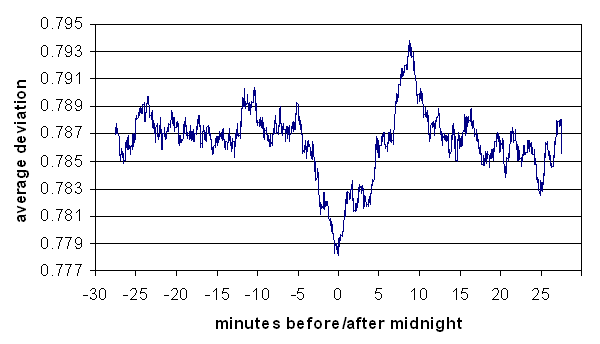
Z-score, Average Deviation of eggs at Y2K

Kurtosis Measure, Z-score format, GCP Data around Midnight, Y2K

Other explorations using a related kurtosis measure (X = e^-kurt) yield similar results, buttressed by an extensive permutation analysis and application of the procedures to data from 1, 2, and 15 days after the Y2K transition. The following figures display these results. Please note that there remain some problems in the graphs as presented. Although the shape and relative scaling of the different datasets is valid, the "Z-scores" are over-estimated because the data are not normally distributed. The correct Z-scores would be a little more than half as large as indicated on the scale, and the extreme minimum at midnight would have, according to later, corrected analyses, a Z-score between -3.5 and -3.8, corresponding to an odds ratio on the order of 1000 or 10000 to 1. In addition, the validity of these analyses is disputed because they consider only 24 integer timezones, rather than the 36 that actually exist when all the half-hour and 45-minute offset timezones are included. We do not have available the corresponding figures with data at all 36 midnights, but hope to be able to provide them later. The 36-zone analysis is said to show no effect, in contrast to the present 24-zone analysis, which indicates a hugely significant effect. Z-score, Kurtosis of eggs at Y2K
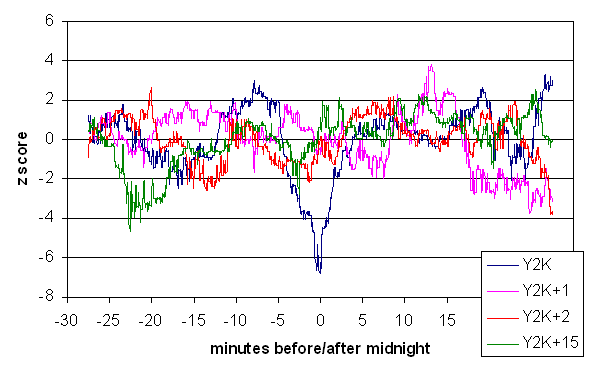
Log Odds Against Chance, GCP Data at Midnight, Y2K and Controls
Log Odds Ratio of eggs at Y2K

Z-score, Kurtosis measure, GCP Data, New Years, 1998
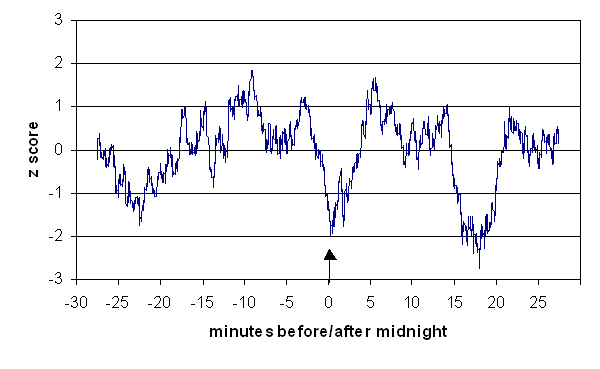
Kurtosis fig for 1998 data

An earlier version of the analysis used similar smoothing, but a complex score involving median values of averaged deviations. It led to the kurtosis measure, which in turn led to the simpler variance procedure presented in the formal analysis. These exploratory figures are of interest because they also show that the data are different from expectation around midnight, using a methodology that is quite distinct.
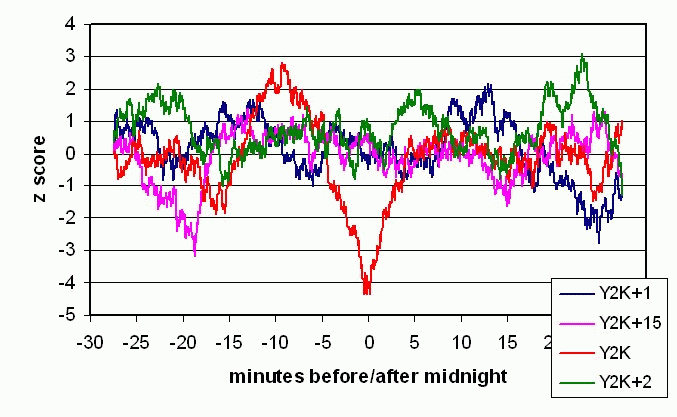
Z-score, Average Deviation of
eggs at Y2K

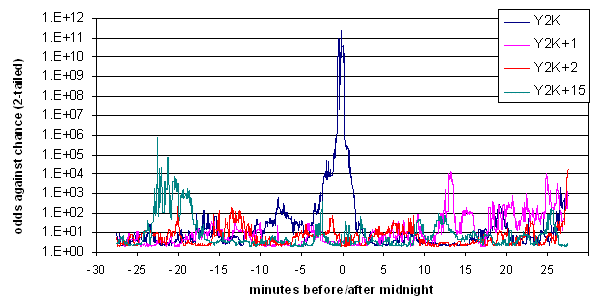
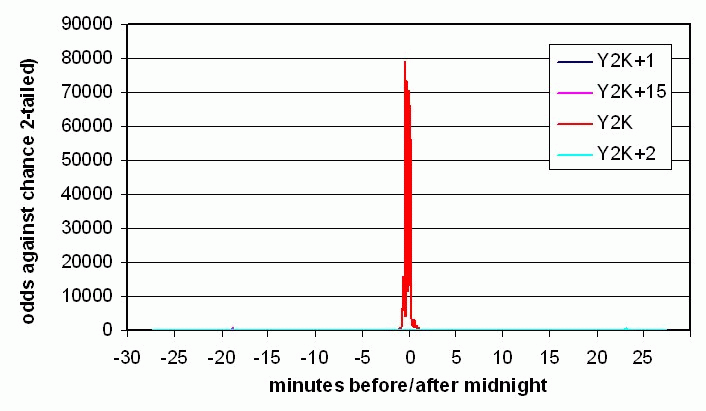
Using the same data, the next figure shows the likelihood of extreme excursions of median values in blocked average absolute deviations of the EGG data from chance expectation as an odds ratio; see the description for a full explanation of the procedure.

Odds Against Chance, GCP Data at Midnight, Y2K and Controls
Odds Ratio of eggs at Y2K

The spike at midnight in the Y2K trace is so extreme that other variations are too small to be examined in a linearly scaled presentation. A log scale for the odds ratio allows the details to be visualized. The odds for the Y2K data are consistently large around midnight plus or minus a few minutes, and peak within seconds of the transitional moment. For the control days, the odds during this period are about equally often smaller and larger than 1/1.

Log Odds Against Chance, GCP Data at Midnight, Y2K and Controls

Log Odds Ratio of eggs at Y2K

Difference Between High and Low Population Time Zones, Y2K

In another exploration using the absolute deviation approach to the data, Dean examined the split between data from time zones with low and high populations. A complete description of this refinement details the procedure. Two figures show the average median absolute deviation for the two population densities, and the difference between the two data categories. The figures show a strong focus at midnight, with the maximum difference at nine seconds before the Y2K transition. The hypothesis, again, is that all eggs would respond to the stroke-of-midnight moment of coherence, but this analysis examines the further hypothesis that there should be different "amounts" of coherence created as each timezone passed midnight, given that the world's population is not distributed uniformly.
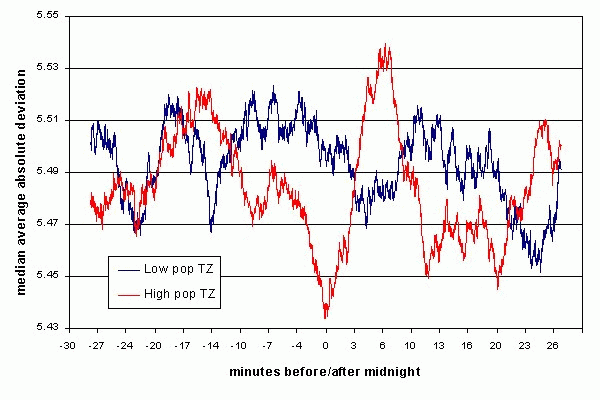
Median Avg Abs Dev, Low and High
population time zones

Difference of Low and High
population Odds Ratios


Afterword, on interpretation, RDN

These results, and some others in the GCP database, have generated considerable commentary, and among the alternative explanations which are offered is the suggestion that it may all be an "experimenter effect." This is not meant as a suggestion that there is anything wrong with the machines, or the protocols, but as an interpretation that the source of the effect is not some sort of global consciousness, but the intentions, the consciousness of the experimenters. I mentioned this concern to a sage I know and she said, "So what? We can all be experimenters."

That made me laugh a lot, for it does so succinctly put the point that a real effect in this stuff is meaningful, even if it doesn't mean what we might have wished, or what we imagined we could show.


Return to top

GCP Home