Formal Year 2000 Analyses, GdB
Most of the following tables and figures were created by George deBeaumont. Interpretive remarks are by Roger Nelson, whom you should contact if you have questions.
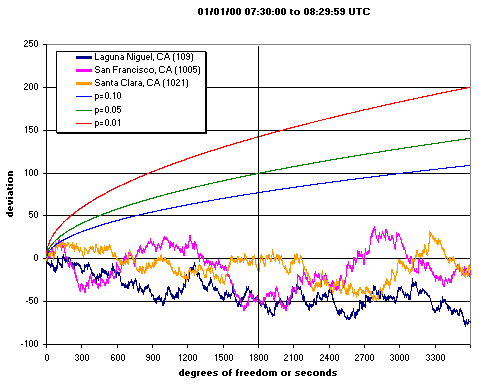
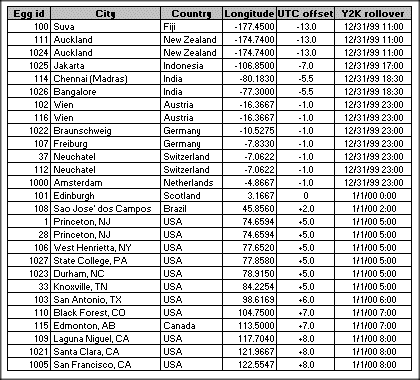
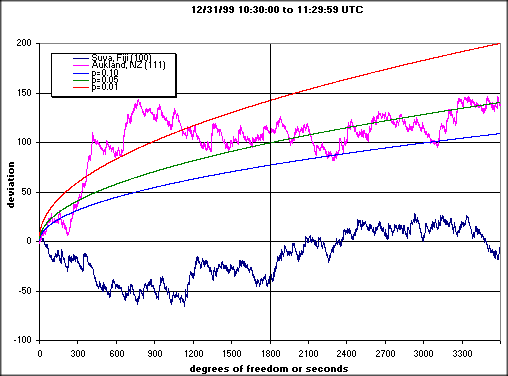
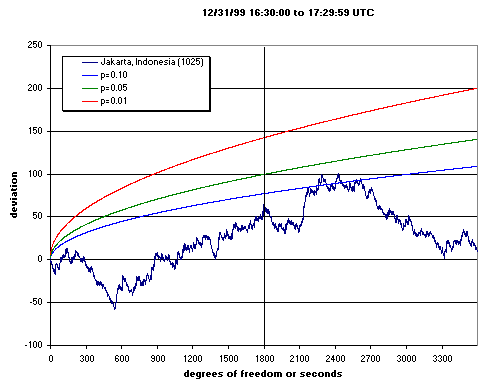
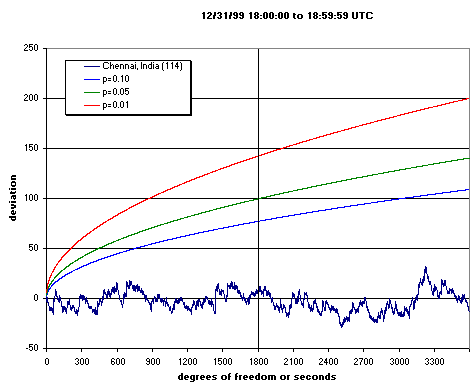
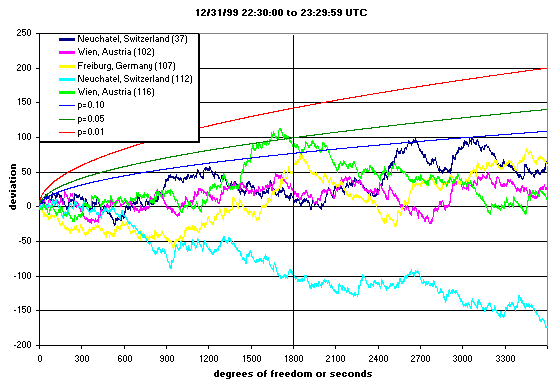
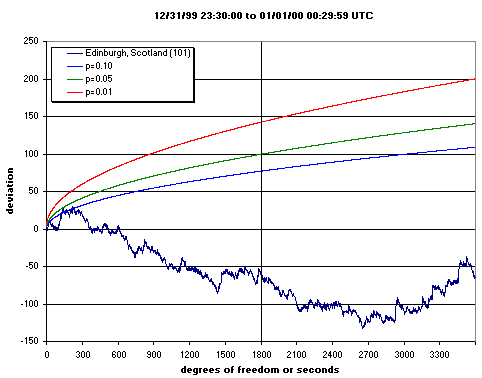
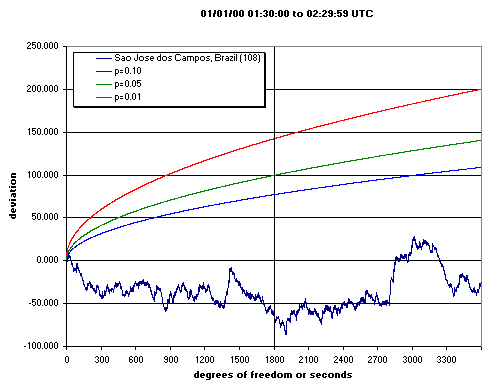
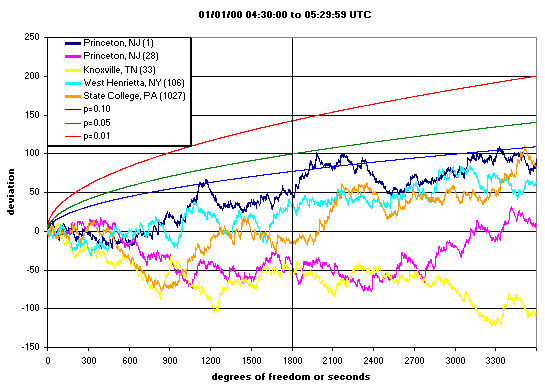
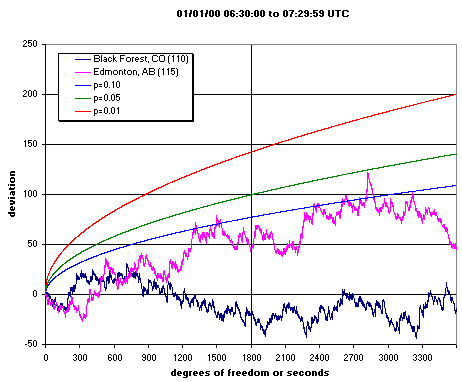
On Saturday, 1 Jan 2000, George sent the first-cut analyses of the set of 21 eggs which had reported as of that date. Seven have not yet reported, but probably do have data. The first two items here are duplicated in the previous page of early results, but are included here for completeness. The table lists the eggs ordered by longitude. The figures show the cumulative deviation of Chisquare (Z²) from theoretical expectation versus the time in seconds (or degrees of freedom). Each line represents one egg as it sees the Y2K rollover, and shows 1/2 hour before and after the event.
Table 1: Descriptive Information, All Eggs as of 2000-01-01
Suva, Fiji; Auckland, New Zealand, 111
Jakarta, Indonesia
Chennai, India
Europe: Wien, Austria; Neuchatel, Switzerland; Freiburg, Germany
Edinburgh, Scotland
Sao Jose dos Campos, Brazil
US Eastern: Princeton, NJ; Knoxville, TN; State College, PA; West Henrietta, NY
Central and Mountain: Black Forest, CO; Edmonton, AB, Canada
US Pacific: Laguna Niguel, CA; San Francisco, CA; Santa Clara, CA
