Sunspot Cycles and GCP Longterm Trends
A visual comparison
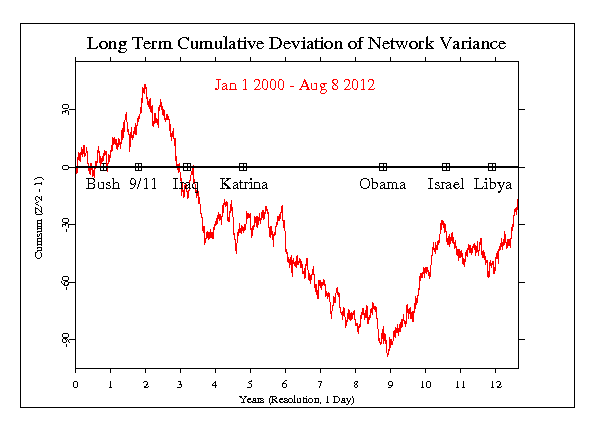
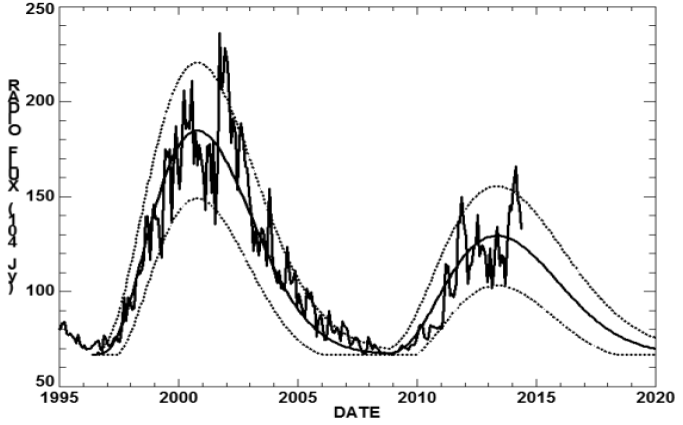
This is a very rough graphical comparison of the trends in GCP’s long term network variance measure and in Sunspot Cycles over the same time period. No rigorous analysis has been done at this time (2014) but the similar trends in these figures suggest it would be of value. If, as appears to be the case, these datasets are actually correlated, it implies that there may be a linkage.
We do not suppose a physical influence of solar flux on the RNGs in the GCP network. Instead, given there is evidence that sunspots affect people in various ways, it may be that such effects on psychological and emotional conditions could manifest in changes seen in GCP data, which exhibit correlations to human-centric events in the world.
Longterm Netvar Trend vs Sunspot Cycles


