Explorations: Display Styles, Statistical Approaches
Graphics
Topological Presentation of Data
For an interesting, and potentially informative display of the data for a day, The Z-squared values for each 15-minute block for each egg are used in a 96 x N-eggs array that forms the basis for a topological map
of the REG activity for one full day (10 July 1999).
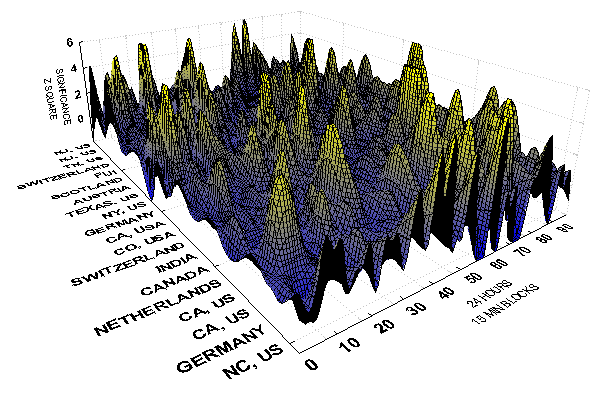
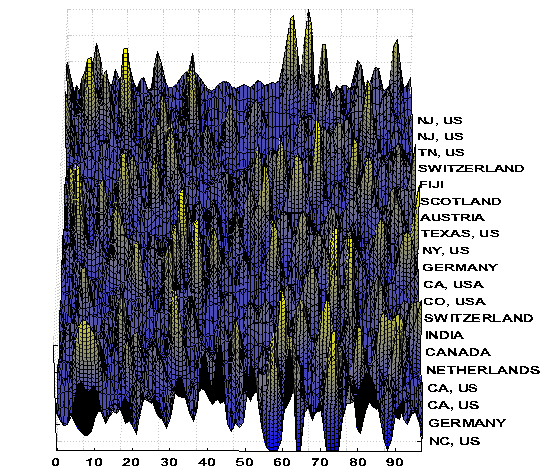
The same data, in a flat
perspective that allows visualization of concentrations of activity in ridges
corresponding to time periods or egg clusters. Note the dearth of activity around noontime, UTC.
Statistics
Split Half Reliability
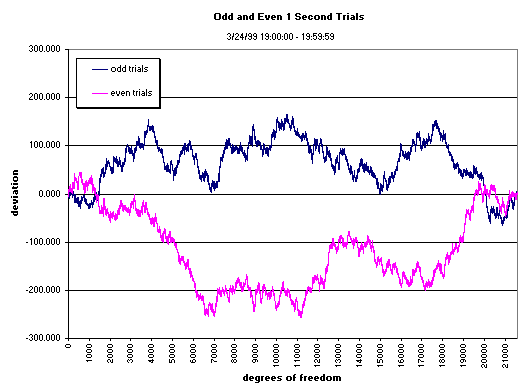
A very good check on the reliability of an analysis can be generated by arbitrarily splitting the data into two halves, and processing them independently. If the impression of an effect in the data is in fact based on chance fluctuations, it is not likely to show in both halves. On the other hand, if there is a source driving the effect, it should manifest in both subsets independently. The following figure shows the results of a split half analysis on the Yugoslavia Bombing data using this algorithm: split the 1 second trials into odd and even buckets (1st second, 12 egg trial values into table A, 2nd second, 12 egg trial values into table B etc...) We notice that the two data series mirror each other in their major features and the final chi-square value for BOTH series is 21599.0 at 21,600 df.
George reminds me of an implication, I know you’ve wondered if the universe was laughing at these endeavors... maybe you should add this to your list of anecdotal evidence.
Yes, I think we should!
Inter-Correlation Matrix
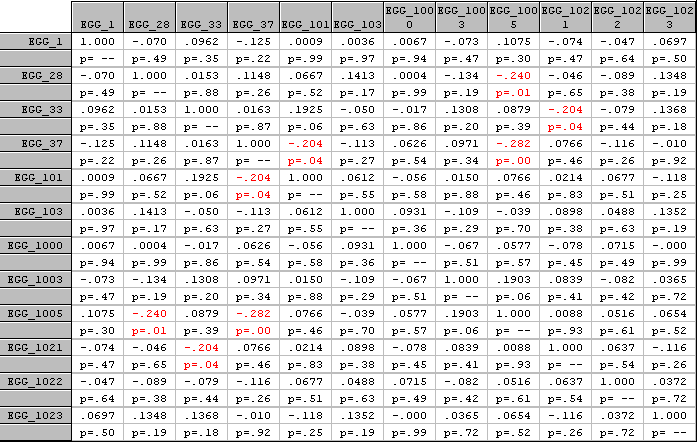
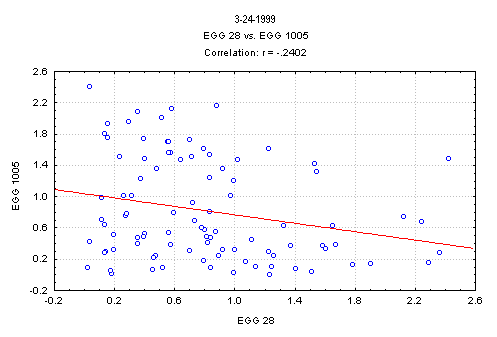
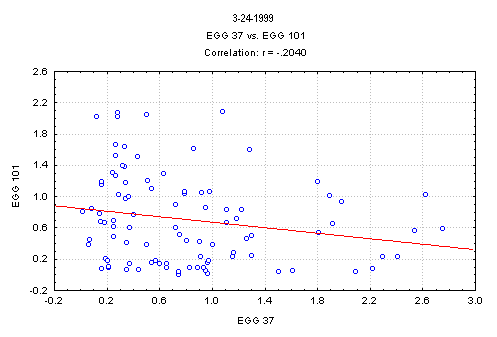
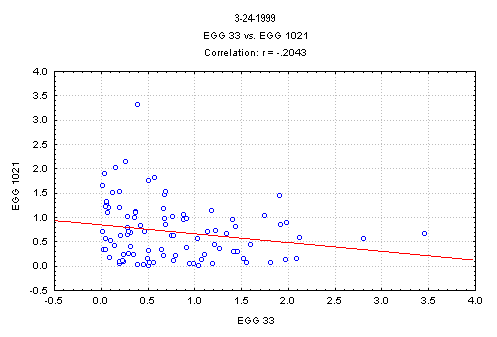
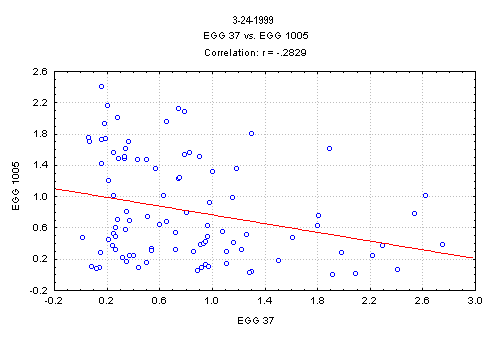
A general procedure for determining whether there is any effect on the Eggs from global events, either unknown or sufficiently newsworthy to provoke a GCP prediction, is to examine the intercorrelations across the eggs. Given that they are independent sources of data, and widely dispersed so that no ordinary local perturbative forces could similiarly affect them, there should be no tendency for the correlation matrix to show anything but chance fluctuations. If instead, we see a tendency for correlation among the Chisquare values generated by the individual eggs, this indicates a global source of anomalous effect in accordance with the GCP’s general hypothesis. A beginning has been made to explore this possibility. The following table shows the correlation matrix for one day (March 24, 1999). It reveals a few large correlations, and a Bonferroni-adjusted probability suggests that this day did exhibit significant intercorrelation.
(July, 1999, RDN, Graphics by George deBeaumont).
