Starbucks Love Project |
|
I was sent a link to the Starbucks Love Project video on YouTube, with a recommendation to enjoy it. Actually very delightful, and also a potential Global Event for assessment. I learned about it a month after the event, so it was a bit late for entry into the formal series, but worth an exploratory look. The video starts with a description and proceeds with a series of small groups from 156 countries around the world singing the Beatles song, "All You Need is Love". It is very nice to see all these people singing together, quite moving:
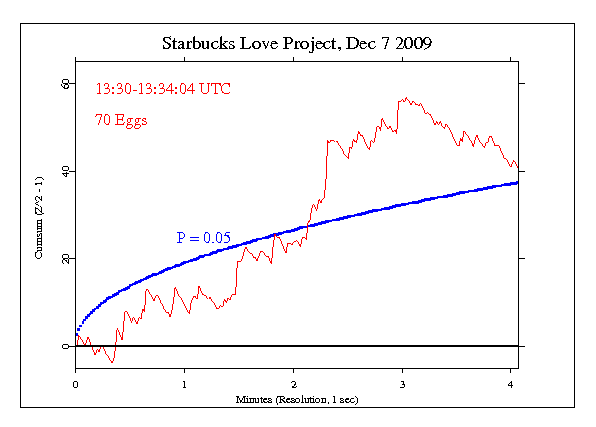
The analysis I did was of data corresponding to the time of the Youtube video, which is 4 minutes and 4 seconds long. The graph is a rather pretty outcome, with a surprisingly strong trend. It's not appropriate to do statistics on an informal event, and in any case such a short piece or indeed even longer single events are not reliably interpretable, but here is what that 4-minute data segment looks like.

It is important to keep in mind that we have only a tiny statistical effect, so that it is always hard to distinguish signal from noise. This means that every "success" might be largely driven by chance, and every "null" might include a real signal overwhelmed by noise. In the long run, a real effect can be identified only by patiently accumulating replications of similar analyses.
|