|
We are approximately at the peak of the 11-year solar activity cycle,
and solar flares have been in the news. A major event was recorded on
March 29 2001, and described in the reports of the National Oceanic and
Atmospheric Administration (NOAA):
SPACE WEATHER BULLETIN #01- 2
2001 March 29 at 10:07 a.m. MST (2001 March 29 1707 UT)
**** MAJOR SOLAR FLARE ERUPTS, MORE POSSIBLE ****
Space weather increased to strong levels due to a major solar flare
eruption. A category R3 (strong) radio blackout
occurred today at 3:15 a.m. MST (2001 March 29 1015 UTC). The
blackout was caused by a major solar flare eruption
from a very large, complex sunspot group, referred to by NOAA space
weather forecasters as Region 9393. Category R3
radio blackouts adversely affect high-frequency radio
communications and low-frequency navigation signals on the sunlit
side of Earth. As a result this morning's flare, a category S1
(minor) solar radiation storm
began at 9:35 a.m. MST (2001 March 29 1635 UTC). Category S1 solar
radiation storms will adversely affect high
frequency radio communications in the polar regions. Forecasters
also expect geomagnetic storms reaching category G1
(minor) to G2 (moderate) to occur during March 30 - April 1 as a
result of recent Earth-directed coronal mass ejections.
Power systems, spacecraft operations, and high-frequency radio
communications are adversely affected by geomagnetic
storms. In addition, aurora may be visible along the northern tier
of the U.S. this weekend. NOAA forecasters expect that
Region 9393 will produce more major flares before it rotates to the
far side of the Sun on April 5.
The NOAA website, under "Solar
Weather Now" provides a thorough description and presents summaries of
the data in excellent graphical displays.
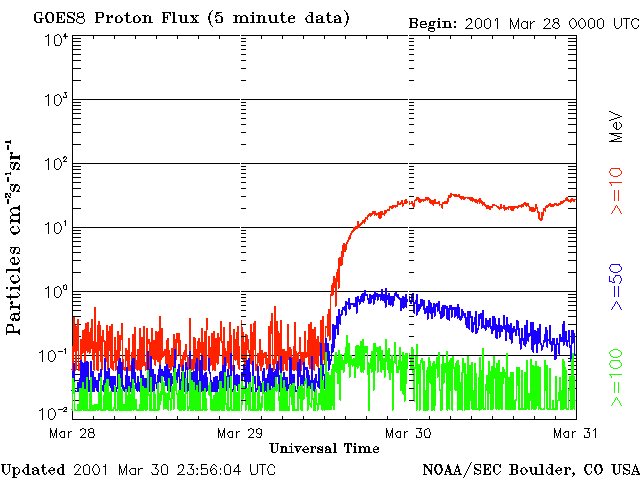
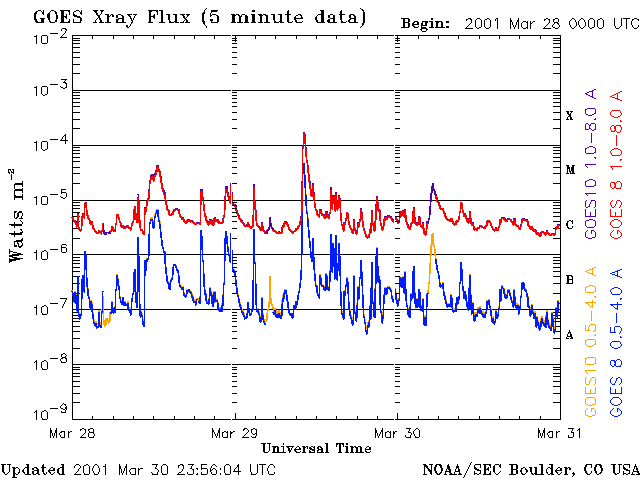
Here are two images from their library
that show very clear effects of this event in terms of proton
flux and x-ray flux. Both graphs show three days, with March 29 in the
center.


The EGG data
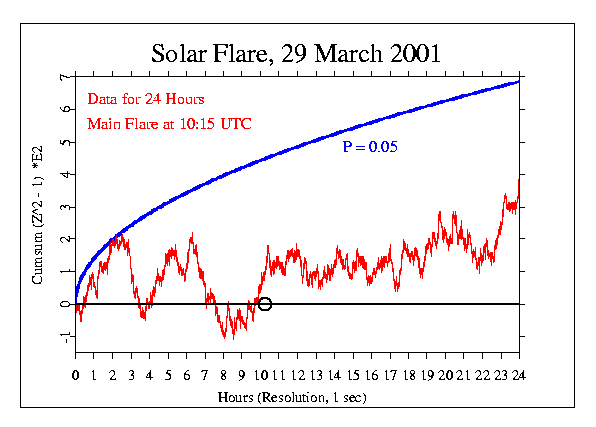
To see whether these major bombardments of the earth with unusual
amounts of energy flux might affect the GCP/EGG network, the data from
the 29th were treated in the usual manner, resulting in the following
plot of cumulative deviation of Z² from chance expectation. The
moment of the most extreme flare is marked. By inspection, it is
apparent that the data show normal variation, and there is no obvious
correlation with the solar flare data shown in the previous graphs.

| 

