| Current Results |
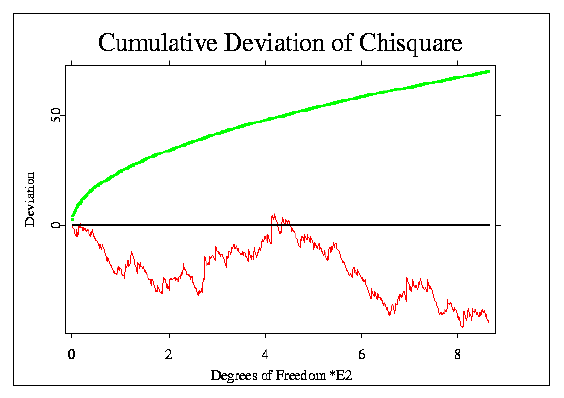
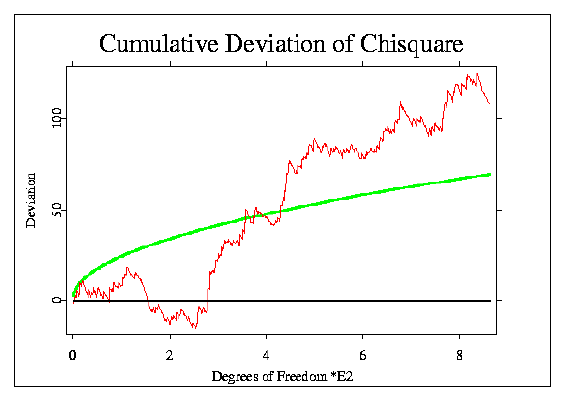
| NEW YEAR TRANSITION One of the most obvious events for which some predictions might be made is the relatively world-wide celebration of the New Year transition. The primary prediction is for an accumulation of deviations across all timezones, but first we may want to look at the context. A global perspective of the GCP network activity may be gained from a look at the cumulative deviation of Z² (Chisquare) for the last day of 1998 (UTC), where we see apparently random fluctuation with a slight negative trend (see graph below),  and the first day of 1999 (UTC), which shows a highly significant composite deviation (Chisquare is 971.4 on 863 df, p = 0.0058) (see graph below). 
Of course the actual transition of
New Years happens at different times depending on location, so the 24 celebrations occur
at UTC ± 12 hours -- from 31 Dec, 12:00 noon to 1 Jan 12:00 noon UTC.
For the New Year transition 1998 to
1999, a general prediction was made of excess variance around midnight.
This may be thought of as an accumulation of deviations in data from all
the midnights.
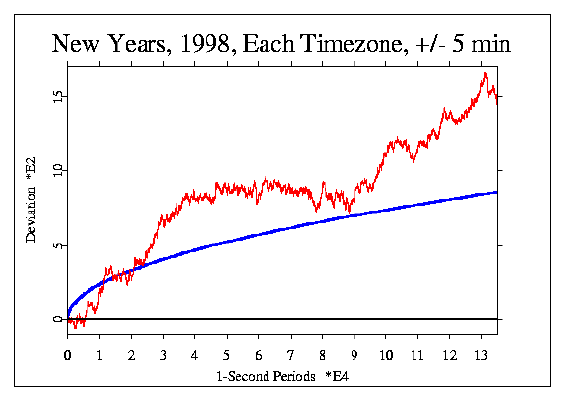
The following figure shows the concatenated data for all 24 primary
timezones at midnight ± five minutes.
The horizontal line at y = 0 shows the expected value for
the deviations. The irregular, jagged line (red) is the random walk
generated by the data, which shows a
strong trend overall, and some smaller segments with relatively flat
slopes. The smooth, parabolic curve
(blue) represents the widely used standard for statistical significance
at p = 0.05. In this case, the data far
exceed this criterion; the probability for the total deviation is
0.0031.
|
