|
The three primary analyses for New Years 2000-2001 are complete as
of January 7th, 2001. All of the synchronized eggs have reported as of this
date, with 35 of the current total of 37 eggs archived on
December 31, and 34 of 37 on January 1.
The formal analyses are based on the fully detailed data, with
1-second resolution, and use data only from the synchronized eggs. Four
eggs were definitely not synchronized, and three others were probably off by
a few seconds, but all analyses are based on at least 27 eggs.
A composite across timezones is specified (the composite is the same
procedure as signal averaging, say, for evoked potentials.)
A simple picture of time differences around the world assumes 24
timezones, but the formal analysis is based on
37 official timezones, from -14 to +12 hours from GMT, including 10
zones with half-hour offsets.
-
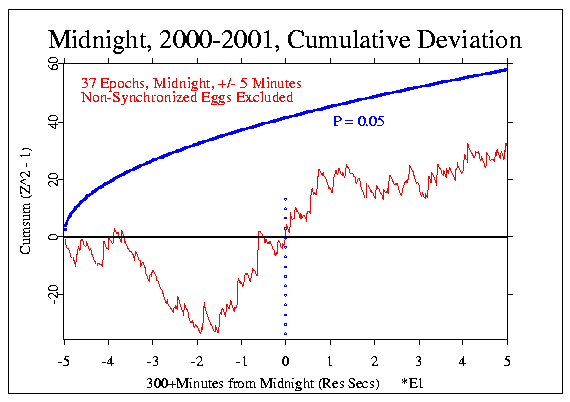
The 10 minute period surrounding midnight, which corresponds to
the first of the formal predictions, shows a modest positive trend,
with Chisquare = 633.16 on 600 df, p = 0.169. There is a sharper
positive incline for a few minute just at midnight. The three-minute
period surrounding midnight has Chisquare = 230.02 on 180 df, p =
0.00696 (which is interesting but non-formal because the specification
was made post hoc).
The following figure shows the data for the formal prediction.
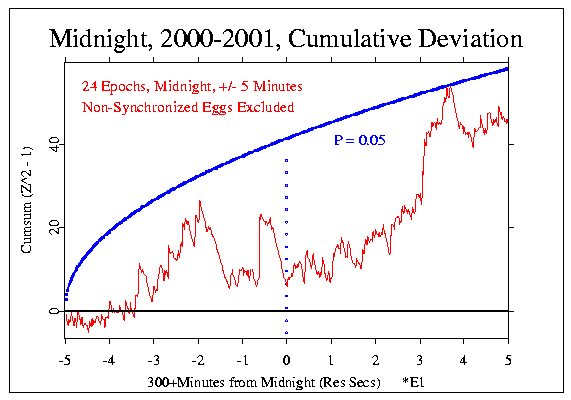
The corresponding figure using the simple 24 timezone analysis has a
somewhat stronger deviation, yielding Chisquare = 646.46, 600 df, and p
= 0.092. Again, this is not a formal outcome, but is shown for context.
-
The second of the formal predictions for New Years 2000-2001 is based on
Dean Radin's Y2K prediction of reduced variance near midnight.
To test it, the variance across eggs was normalized as Z-scores for each
second, then squared. The result was smoothed with a running mean using
a fairly wide window of 240 points. As in the Y2K 1999-2000 analysis,
the smoothed curve displays a clear reduction of the
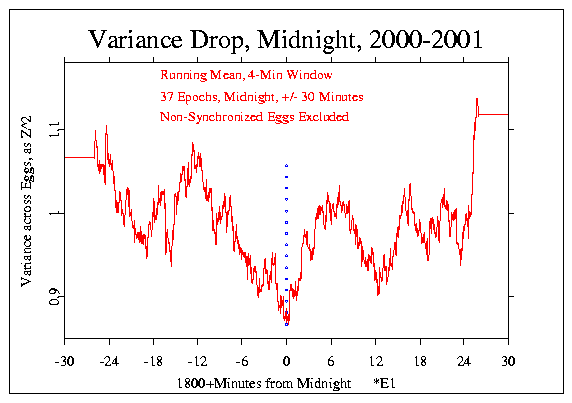
variability of the Z-scores around midnight. The following
figure shows a one-hour period centered on the New Year celebration.
The red curve io the running mean of the normalized variance as
Z².
The smoothing window is 4 minutes wide,
and was selected as the best of 10 window sizes,
from 1, 2, ..., 10 minutes, to emphasize the focus at midnight.
A correction for this "multiple analysis" selection is required, and is
indicated below.
An estimate for the likelihood of the apparent structure cannot readily
be made on the basis of theoretical expectations, so a permutation
procedure was used.
The original data represent a superimposition that
is an average across the 37 timezones (signal averaging).
The 60 minutes centered on midnight comprises 3600 datapoints.
To estimate the likelihood of the variance reduction at midnight,
the signal averaged data
were randomly permuted 10000 times. The figure shows the
original or "true" data in red.
There were 65 cases in the distribution of random permutations
where the minimum
variance was closer to midnight than the original data, corresponding to
a probability of p = 0.0065. With a correction factor of 10 (the
Bonferroni adjustment for multiple analysis), the final
probablility becomes p = 0.065, which is marginally significant.
Another permutation analysis to estimate the frequency of this
degree of variance reduction at midnight found that
in 10000 cases, over half (p = 0.5213)
had a more extreme reduction somewhere in the hour long period
surrounding midnight. When the measures of proxmity and degree are
combined, the resulting probability is 0.0338.
A second approach to the calculation is more transparent, and simply asks
how many of the 10000 permutions yield a deeper reduction at midnight.
The answer is very similar to the previous outcome, with p = 0.274.
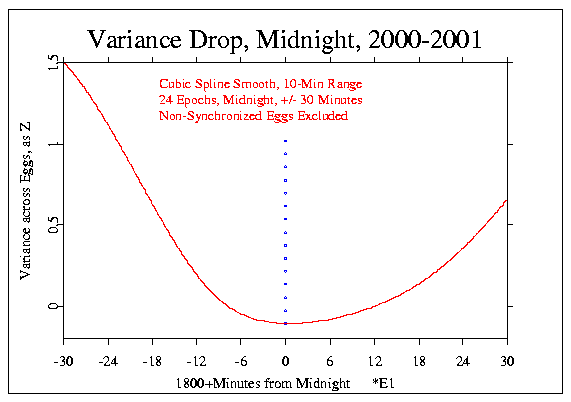
The next figure, showing the general trend of the variance,
is a cubic spline fit using a 10-minute window, which produces a smooth
curve that shows a general lessening of variance as
midnight approaches, and a slow return to a higher level.
This is not a formal analysis, but is presented here to provide
context.
-
There was a very strong focus on midnight, GMT, in last year's
analysis. Again this year, the period around midnight, GMT, was
examined in detail because of the 010101
Lovewave event, for which we made a formal prediction.
While a simple cumulative deviation of the data beginning at 11:00 on
the 31st and ending at 01:00 January 1st shows no significant
overall trend (Chisquare 7190.8 on 7200 df, p = 0.528),
the details close to midnight are striking.
The GMT analysis of the Lovewave event is displayed in the
next figure, which represents the formal prediction based on the
expectations of Andreas Buechel, who was the organizer.
This is, like the variance reduction, a focused analysis, using
smoothing to reveal the trends around the moment of midnight. The
figure shows the deviation of the variance across eggs,
smoothed by a running mean with a 4-minute window. This was chosen to
conform to the primary variance analysis specifications.
The likelihood estimate for the apparent structure is again generated by
a combination of the proximity (p = 0.113), and magnitude of the
minimum deviation (p = 0.459). This yields a joint probability of
0.052, but the formal test is a single-distribution probability from the
combination of Minimum x Distance, which is marginally significant
at p = 0.094. (All probability estimates are based on 10,000
permutations of the half-hour's data).
Probably for most of us, the appearance of the data trace is more
impressive as a highly appropriate match to
the notion of a "wave" of consciousness across the period of time
set by Andreas in his invitation to meditate on love. The combination
of science and art gives us a richer view of the world than we
could have from science -- or art -- alone.

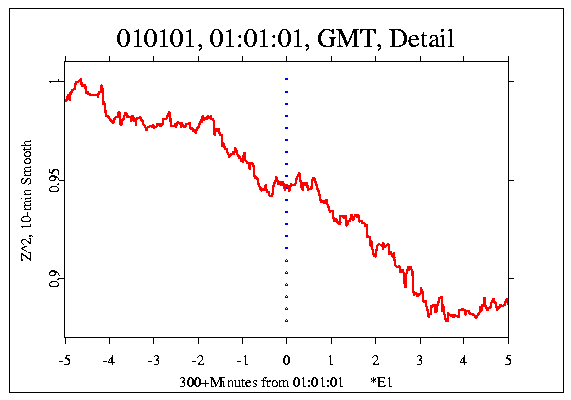
While the formal prediction focused on midnight, a second GMT
analysis was generated from the Lovewave event. It
was timed for the "symbolic" value of the date and time expressed as
010101010101, or Jan 01 2001 at 01:01:01. This is not a formal
analysis, but the trends around that time are very striking.
The next image shows the same type of data as for the moment of midnight.
It is a very different picture, but hardly seems to be chance
fluctuation. Especially noteworthy is the period of two minutes or so
exactly centered on the moment of 01:01:01. It looks like a nice
confirmation of Arnold Lettieri's prediction that this moment would
produce data "as flat as a pancake."
|