|
On the 28 of September 2004, a
church tower in Cologne, Germany, began leaning because of underground
cavities and construction disturbances. It is the most prominent and
noted tower after the Cathedral. The lean aroused a great deal of
emotional concern for the whole city, and was a focus of attention
because of the apparent imminence of collapse. The tower was stabilized
as quickly as possible, and the danger subsided.
Our egg hosts in
Cologne, Prof. Dr. Johannes Hagel and Margot Tschapke, have an
independent research program using custom random sources, from which
continuous data are recorded. One of these showed strong deviations on
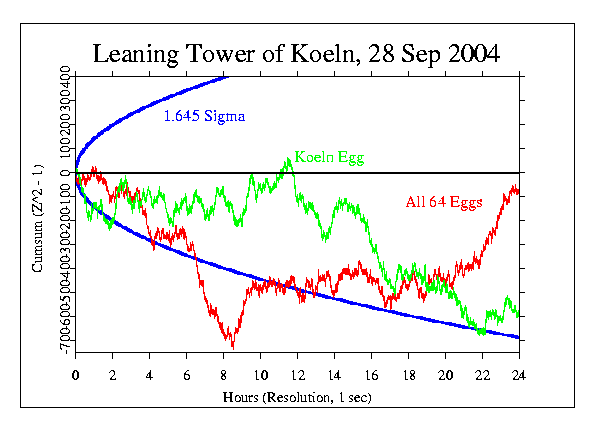
the 28th, and this prompted an exploratory look at the GCP data and the
Cologne egg. The results are shown in the following graph. I asked
Johannes for his intuitions about what we might see, and he made the
following comments.
What I personally expect from your curve comes (1) from the basic
hypothesis of our project that "Events of collective emotional content
cause deviations in RNG's in the spatial neighbourhood to these events" and
(2) from observations we made during the recent two years. One such
observation is that unpreviewed events tend to cause deviations at the
instant of the onset of the collective emotion. For expected
events (like football matches)
we observe deviations already in advance (in the order of hours).
Applying the basic hypothesis and these observations as well as our curve
(mainly RNG1) we would expect a deviation of the cumulative difference
[ CD = #(0) - #(1) ]
starting between 7:00 and 9:00 Cologne local time since this is the period
within which a large number of people learned about the event either by
direct vision or by the local news.
By setting the zero point say to 8:00 we would then expect the z = 2
curve to be cut within the following few hours in either the positive or the
negative direction, where z(n) = sqrt(CD(n)).
If I understood your way of presentation correctly your curve z^2-1
should cut the limit of 3?
While the single egg in Cologne did not show a big response around the
predicted time, There is a strong deviation of the network as a whole,
and its timing is similar to the prediction. Cologne is GMT plus 2
hours, so 8:00 in Cologne corresponds to 6:00 GMT.
The curve (of all eggs) shows a strong inflection at that time, and
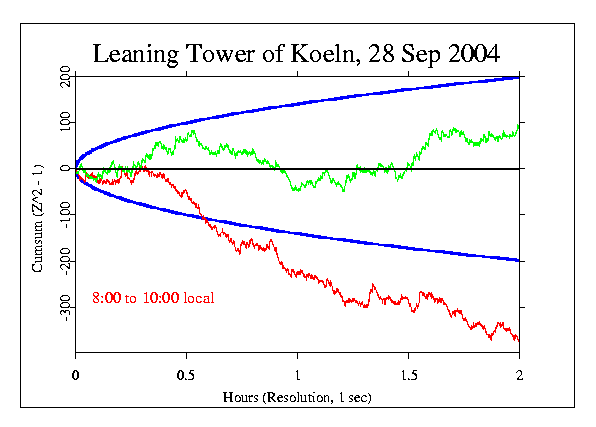
if we calculate a Z-score for the departure from zero over the next two
hours, the steady negative trend does cut the 3 sigma envelope.

Here is the two hour period from 8:00 to 10:00 local time (06:00 to
08:00, GMT).
The negative deviation for all eggs culminates at Z= -3.208.

|