| Geomagnetic Correlations with GCP data |
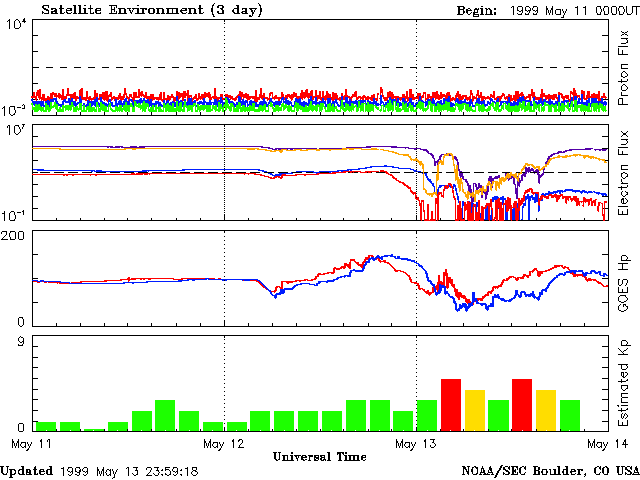
On Tue, 21 Dec 1999, Juan Zapata-Arauco wrote, describing his explorations of various geomagnetic and cosmological measures and possible correlations with GCP data. His email and my responses to questions follow. The topic looked interesting enough to pursue, and the discussion is expanded by some results from related explorations by George deBeaumont. A later analysis by Juan uses an approach similar to one applied by Dean Radin to the Y2K data. > Dear Sir: > > Thank you for the effort maintaining GCP. As > you may know, data from May 10/18:00 UT to May 12/3:00 > UT 1999 are of extraordinary scientific interest due > to coincidence with unprecedented a) low cosmic electron > fluxes, b) near null Geomagnetic field measures (Hp component > measured in space) and consequently, c) very > low values of K and Kp indices measured on Earth. I was not aware of this combination of events, and I am pleased that you have provided the information. Your interest is much appreciated, and I will answer your questions as best I can. The data during the time you specify are quite unusual, and I will make this interesting material available in a webpage on the GCP site. > However, the graphic display of GPC data in UT for May 11 > 1999 (Cumulative Z-Squared Value) shows two details that > easily conduce to misinterpretation when compared with > days before and after this exceptional day: > > 1) [The graph shows] the colors [data] of only three participant > EGGs in the first 12 hours as [compared with] twelve in the > same interval in days around this date, My records do not explicitly tell what happened, but it appears that four or five of the eggs were down for the whole day. I have just rerun the tables for May 11 1999, and two more eggs are now included, making a total of eight. The new data are consonant with the previous strong trends, and only increase the impression that the day was unusual. Here are some rough, but reasonably accurate calculations made by inspection of the cumulative deviation graph: May 11, 6 eggs original: Chisquare = 311, df = 372, p = 0.99054 (0.0095) May 11, 8 eggs update: Chisquare = 520, df = 475, p = 0.99911 (0.00089) All Egg Composite, May 11: Chisquare = 63, df = 96, p = 0.99629 (0.0037) May 10, 18:00 to May 12, 03:00: Chisquare = 835, df = 964, p = 0.99891 (0.0011) Thus, the GCP/EGG data show a very strong trend to smaller than usual deviations during the time period you identify. The results are internally consistent and extremely unlikely to be chance fluctuations. > 2) [The graph shows] the colors of three additional EGGs with > starting times for new cumulative values delayed more than 12 > hours with respect to 0:00 hours UT, normally used for calculating > the daily cumulative values, and these seem (at least > graphically) to be added without considering these > delays in producing the total Cumulative Value for this day. The total Cumulative Value (All Egg Composite) is calculated by taking the average across all the available eggs, for each 15-minute time block. You can see that the Z-scores in the right-most column of Table 1 are computed by comparing the number of Ones against the number of Trials, and when a new egg is added later in the day, the numbers of Ones/Trials increases appropriately. In this case, the All Egg Composite shows the same tendency as the individual eggs, although they are largely independent. > > Please correct me if I am misreading the cumulative > graphic for this special day and clear any > misconception about the participant EGGs (colors) that > took data during the day (I apply the color code for 1/1/99 and > I doubt that this is appropriate for 5/11/99). The color coding doesn't identify the same eggs on different days, unless exactly the same eggs are running. The colors are assigned sequentially, and are intended only to help distinguish the graphic lines. > > Similarly I would like to know if GCP has animations > ("movies") for these dates. My last browsings of your > collection of movies do not show any for these crucial > interval of days. I checked, and there is no movie for May 11, 1999. These are automatically generated and sometimes fail. > > Congratulations for all the work expended in this > magnificent site. > > With my best regards and wishing you and your staff > Happy Holidays! > > Juan Zapata-Arauco > Independent Researcher ------- more information from Zapata-Arauco A primary source of information about geomagnetic fluctuations is the web page of the Space Environment Center of the National Oceanic and Atmospheric Administration. For three day summaries click the following pages in this order: "Gopher Menu", "Plots of Solar-Geophysical Data", "1999 Plot Files-Jan through Sept", "satenv" and finally "19990508 satenv.gif", "19990511 satenv.gif" and "19990514 satenv.gif". An example graph graph shows the striking differences between relative calm and turbulence in the unseen environment. 
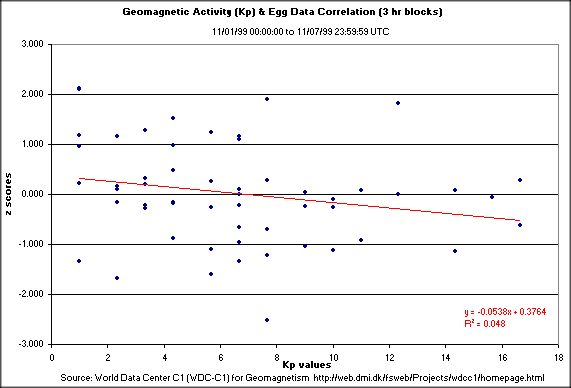
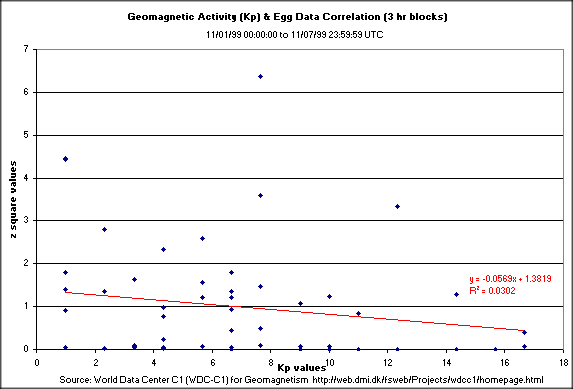
George deBeaumont looked into the the possibility of a general correlation of GCP data with a Geomagnetic measure, as described here. The correlations look impressive, but are not significant; the associated probabilities are between 0.15 and 0.20.
Subject: GCP & geomagnetism
        Date: Mon, 27 Dec 1999 16:35:02 -0800
        From: George deBeaumont
Roger,

Here's an alternative (but complementary) look at the GCP/geomagnetism
issue for the week of 11/1-11/7 (an arbitrary choice on my part).

image1.gif: KP values vs two tailed z score
image2.gif: Kp values vs one tailed distribution (z^2)
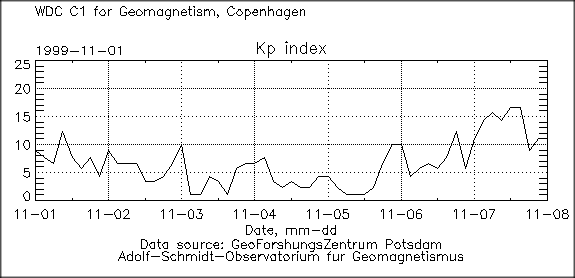
image3.gif: Kp index plot for 11/1/99 thru 11/7/99

The geomagnetic Kp index represents a 3 hour period (therefore 56 values
for the week). I used matching 3 hour blocks for the eggs (collapsed ea.
3 hour period into a single value and normalized).

Is the Kp index a good choice? I dunno :-). As I think I understand it,
Hp and cosmic electron/proton flux values are satellite based
measurements. While K and Kp indices are earth based geomagnetic
measurements (and perhaps more appropriate for a GCP comparison). Each
Kp value is a three hour average of 11-13 earth based stations and seems
to be a "global" type measurement.

For related work indicating possible effects of geomagnetics on consciousness anomalies, by Spottiswoode and May, see "Anomalous Cognition Effect Size: Dependence on Sideral Time and Solar Wind Parameters",1998. link |

