Energy Flow Graph |
|
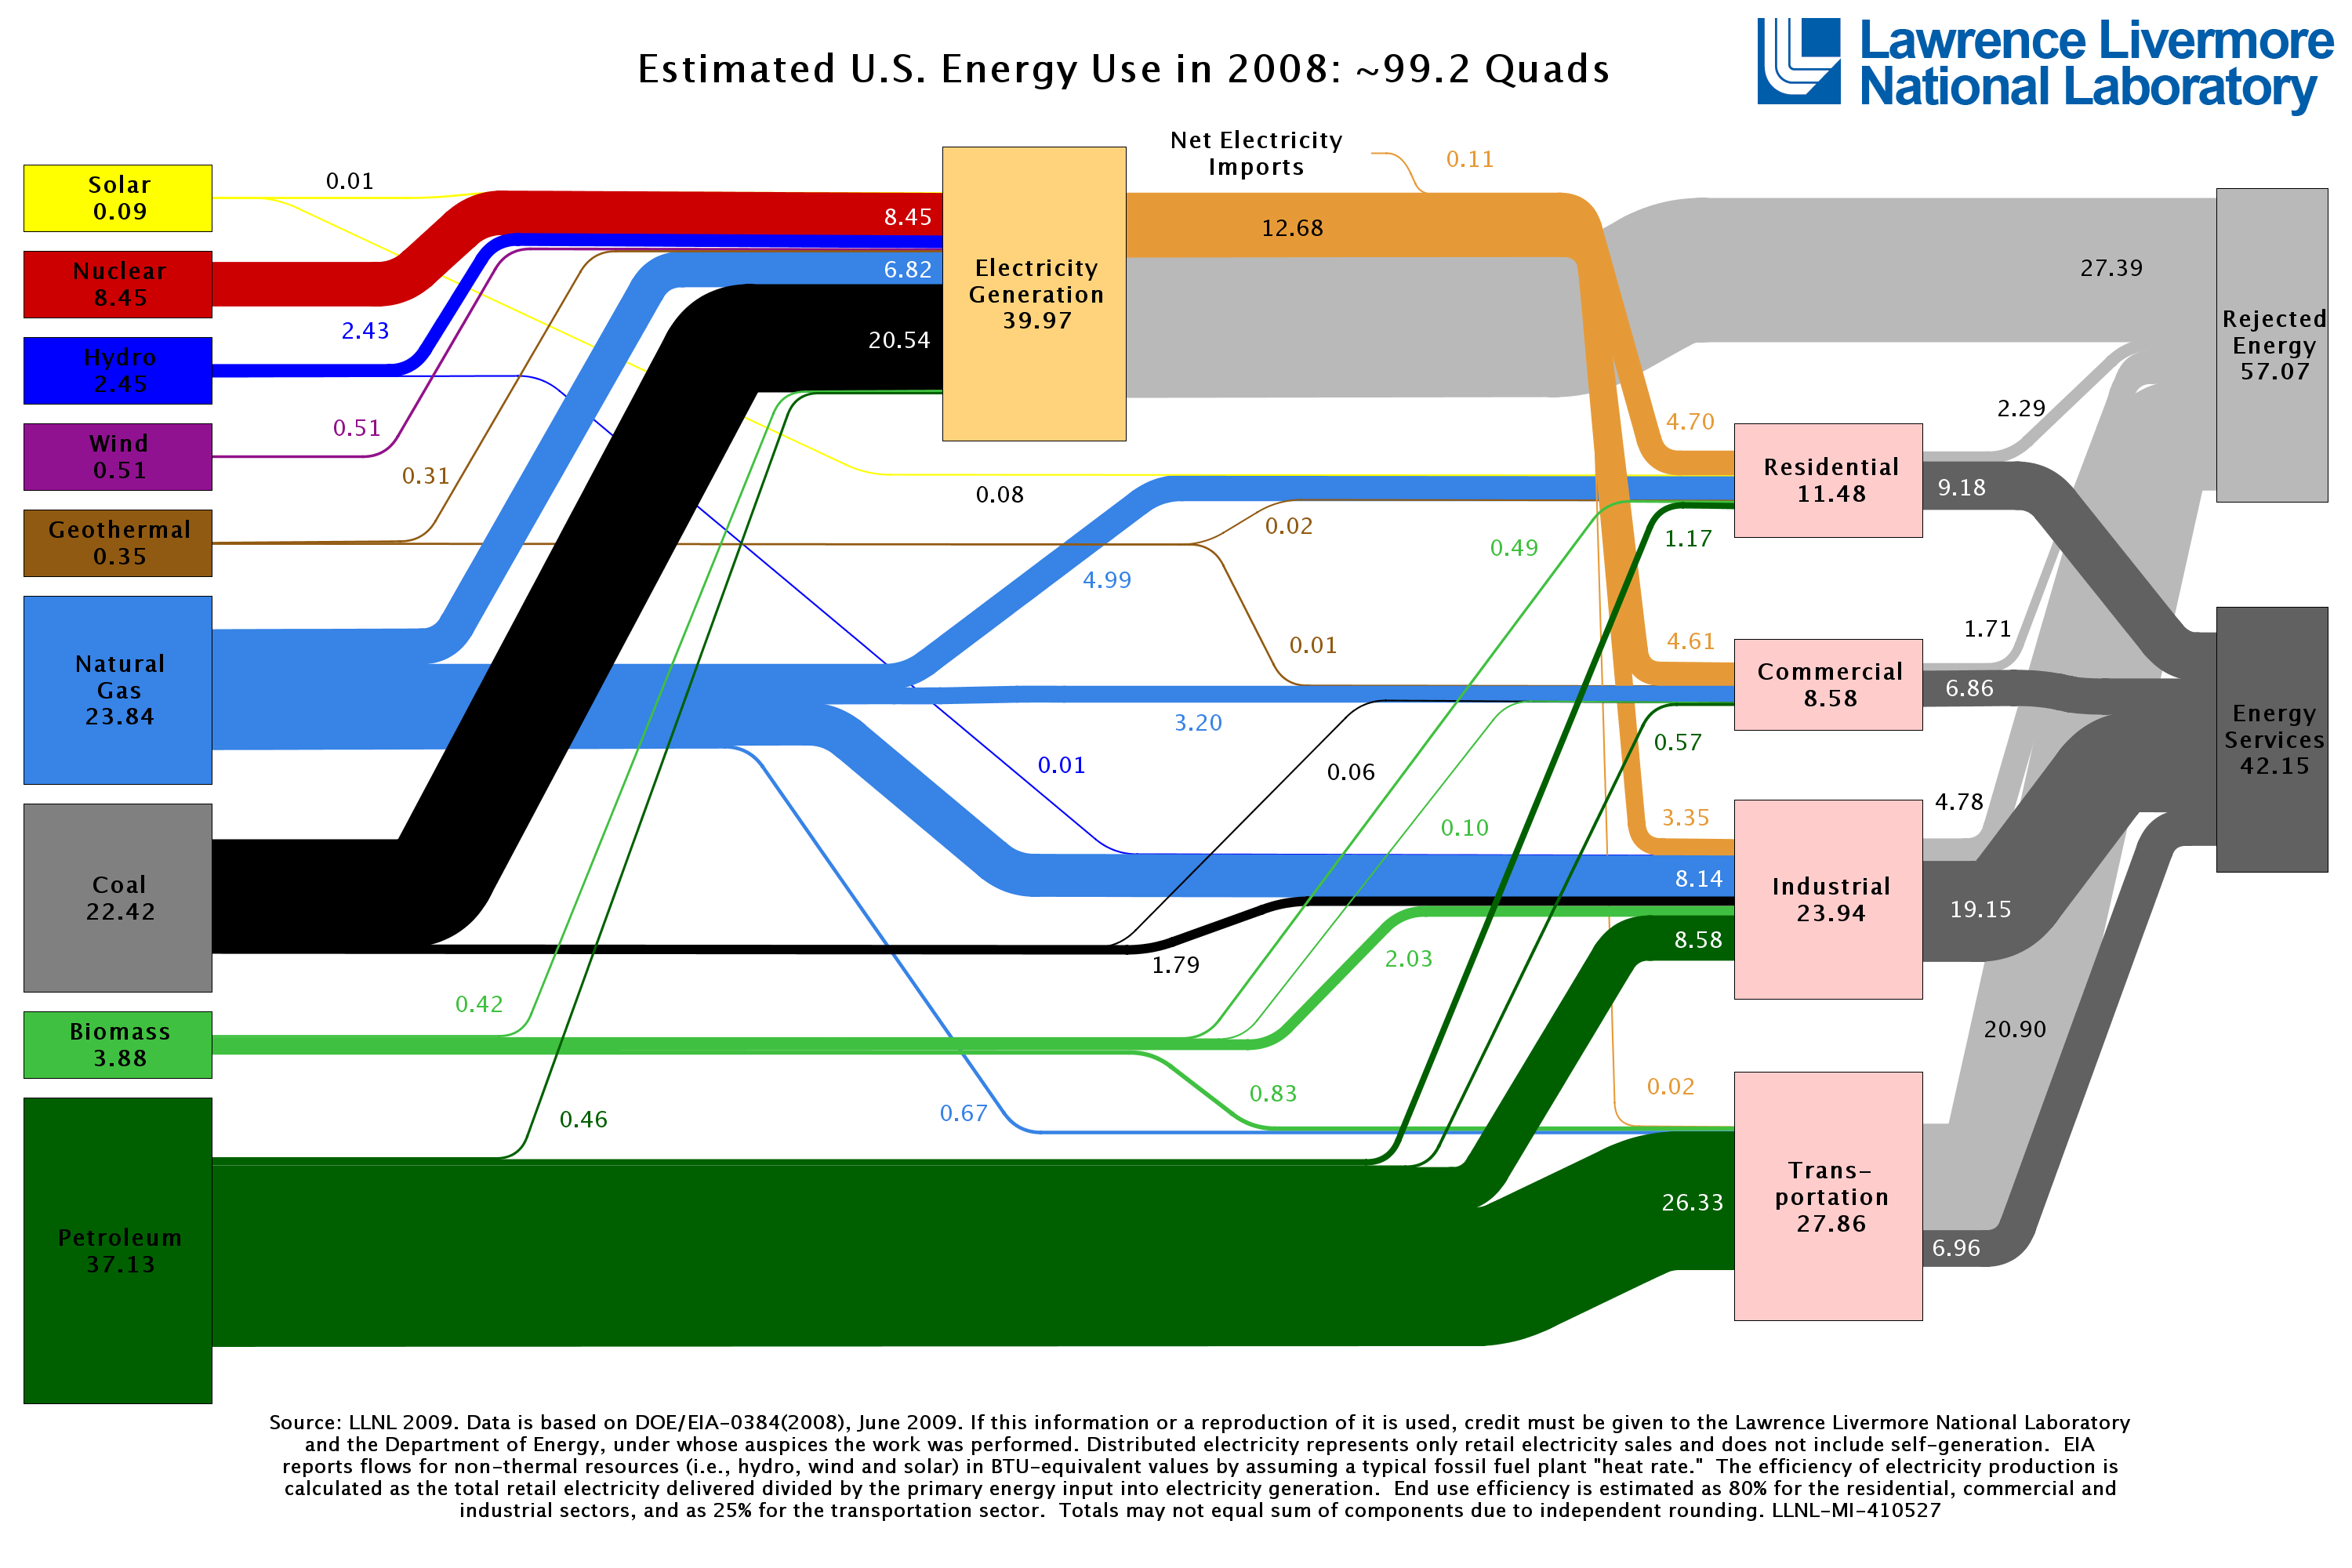
It is such a pleasure to see really high quality graphic displays of data that I am providing a link here to a picture of Energy Flow in the US. This hasn't much to do with global consciousness except that this kind of presentation can help more people understand where we are in history, and how much we need to be working together. That message is perhaps indirect, but I will point out just two easily visible features. One is waste, which is see on the far right. There, the upper block, in gray, shows how much of our energy is simply lost, thrown away. Much of this is unnecessary, but will continue so long as we are unconscious and uncooperative. The second clear understanding is how big the challenge is for moving to a sustainable state where renewable energy takes over for necessarily dwindling fuels and energy sources. What's next? Take a look, maybe a long look at this figure, and think about the implications of various features. Consider the possibilites. There are undoubtably places where you (and I) can do something, or stop doing something and places where we can urge policy and political changes. I would like to think we can do better than just to wait.
I hope the link above remains valid, but in case it goes
defunct, here is the chart. Right click on it for detail.
|