|
This webpage is an exploration of the possibility that a GCP egg that is closely
associated with a person might reflect the most important personal
events. I intend it also as a memorial, and a respectful thank you to a gentle
and generous man, Barry Fenn.
I would like to acknowledge that there are those who might regard
analytical assessment of data in this context as disrespectful.
My apologies to anyone who is pained, but no disrespect is intended.
On the contrary, I feel that it may be
exactly appropriate to look at the data Barry Fenn helped to create,
for possible insight into questions in which he was deeply interested.
Barry found the GCP website fairly early, and offered to host an egg in
Auckland at his company, Aotea Interactive Media,
together with his friend Bryan Roberts. He also arranged for a second egg to be
hosted at the University, by another friend, Prof. Sze Tan.
On May 22, 2000 Barry Fenn died, after a few months' battle with cancer.
I decided to look at the data from the EGG network, and from the eggs
most closely associated with Barry, number 111, at Aotea, and number 1024, at
the University. I asked Bryan if he could tell me when Barry died, and
he gave me some of the details of the last day. New Zealand is 12 hours
earlier than UTC, so the 22nd in Auckland begins on the 21st at 12 noon, UTC.
> I thought it would be appropriate to look at the EGG data
> on the 22 of May, since Barry was genuinely interested in the
> Global Consciousness work.  I don't mean to make a formal
> prediction event out of it, but Barry's death is certainly
> significant in this context, and I think he would agree that
> we ought to try to learn something from the data in an
> exploratory way.  If you have a little more information,
> it would be helpful to know about when Barry died.

The events as I know them... (All times NZST)

Mon 22nd

0700 Barry was taken to hospital

0930 Family notified, travel to hospital

1200 (Approx) Barry died.

1430 Family and close colleges notified

Thurs 25th

1300 Funeral held
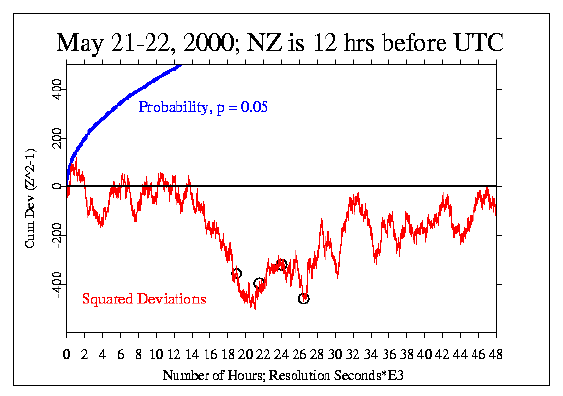
The first image shows the composite across all eggs, with the times
given above indicated by black circles at 7:00, 9:30, 12:00, and 14:30.
There is a long, steady decline in the cumulative Chisquare for several
hours preceding Barry's death. This could be, of course, simply chance
fluctuation, although this part of the graph looks quite distinctive.
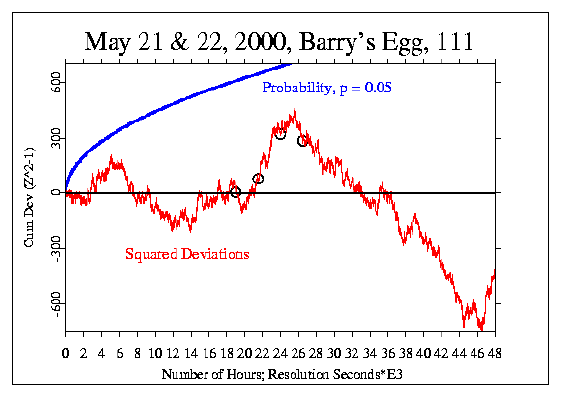
The next figure shows only one egg, number 111, which is Barry's
original egg, located at Aotea.
Black circles indicate 7:00, 9:30, 12:00, and 14:30.
Close examination reveals that this period has a consistent trend,
with larger than expected scores.
The three or four hours from 8 or 9 until Barry's death at about 12:00
show an especially clear trend, which is statistically significant.
Afterward, there is a remarkably long, consistent downward trend that
continues for almost a whole day.
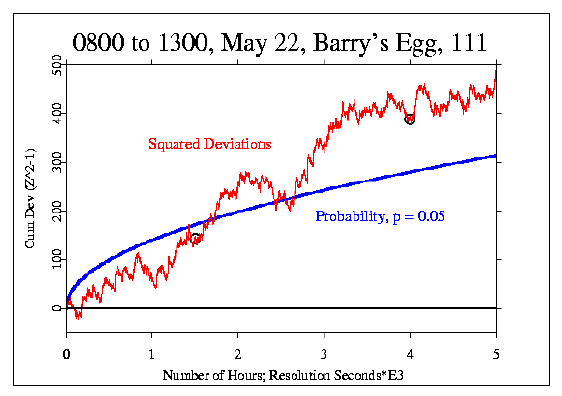
The third graph shows an expanded view of the
period from 0800 to 1300, with circles indicating 9:30 and 12:00.
Here it is quite obvious that the deviation during this time is
significant.
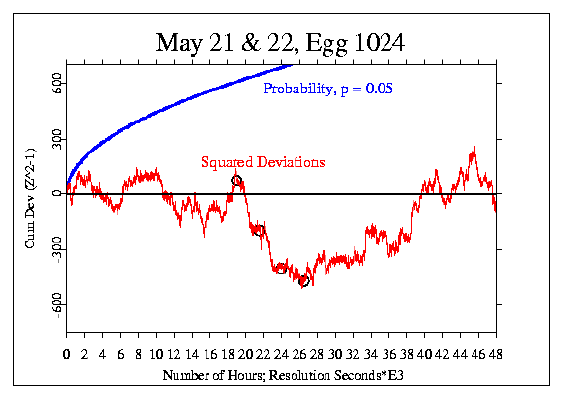
The fourth figure shows the data from egg 1024, located at the University, again
with the times indicated by black circles. In this figure too, the
period before Barry's death has a striking trend. In statistical terms
it is highly significant, but, notably, the direction of the
trend is downward, opposite to
that for egg 111. I also find the remarkably exact placement of the
"events" of the last few hours on distinct inflections of the data
trace quite difficult to regard as mere coincidence.
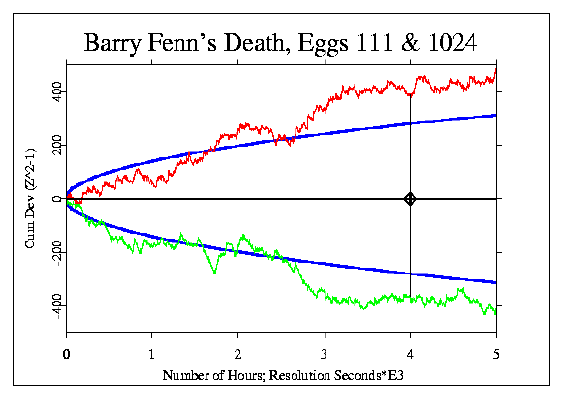
Both of the New Zealand eggs seem to reflect Barry's passing. The next
figure shows the period from 0800 to 1300 for the two eggs. The upper
curve is egg 111, also shown above, and the lower curve is Sze Tan's egg, 1024.
The black line marks Barry's death at about 12 noon. I think the
symmetry of this figure is quite beautiful.
Studying these data in the graphical form, I have the impression that
there is a readable message
in both the individual datastreams from 111 and 1024, and
in the composite across 26 to 28 eggs shown in the first figure. This is not a
formal, statistically justified assessment, but a very direct reading of
the trends. In each case, there is an unusual and very strong,
persistent deviation from ordinary random behavior. In the individual
graphs, the trends during the last few hours before Barry took his
leave are remarkably clear. In the composite figure, I get an
impression of a great, common sigh across the network, beginning eight
or ten hours before the hour of passing, and then, afterward,
a resumption of the normal random walk. Life goes on.
|